| The NutriBase Home window serves as your starting point for several things.
From here, you can:
1) Select which client you want to work with. You can have an unlimited number of clients organized into Client Folders for easy, alphabetical access.
2) Configure your Quick Access Toolbar to provide instant access to the functions you most frequently use.
 3) 3) 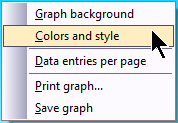 Right click over your graph area to see your setup options. Click on each of these menu options and study your options. You can select background color, background images, graphing styles (line, step, points, hollow, etc.). The “Data entries per page” option lets you select how many entries you include on a single window (a week, a month, a year, etc.). And, of course you can print the graph or save it in a wide variety of image formats. Right click over your graph area to see your setup options. Click on each of these menu options and study your options. You can select background color, background images, graphing styles (line, step, points, hollow, etc.). The “Data entries per page” option lets you select how many entries you include on a single window (a week, a month, a year, etc.). And, of course you can print the graph or save it in a wide variety of image formats.
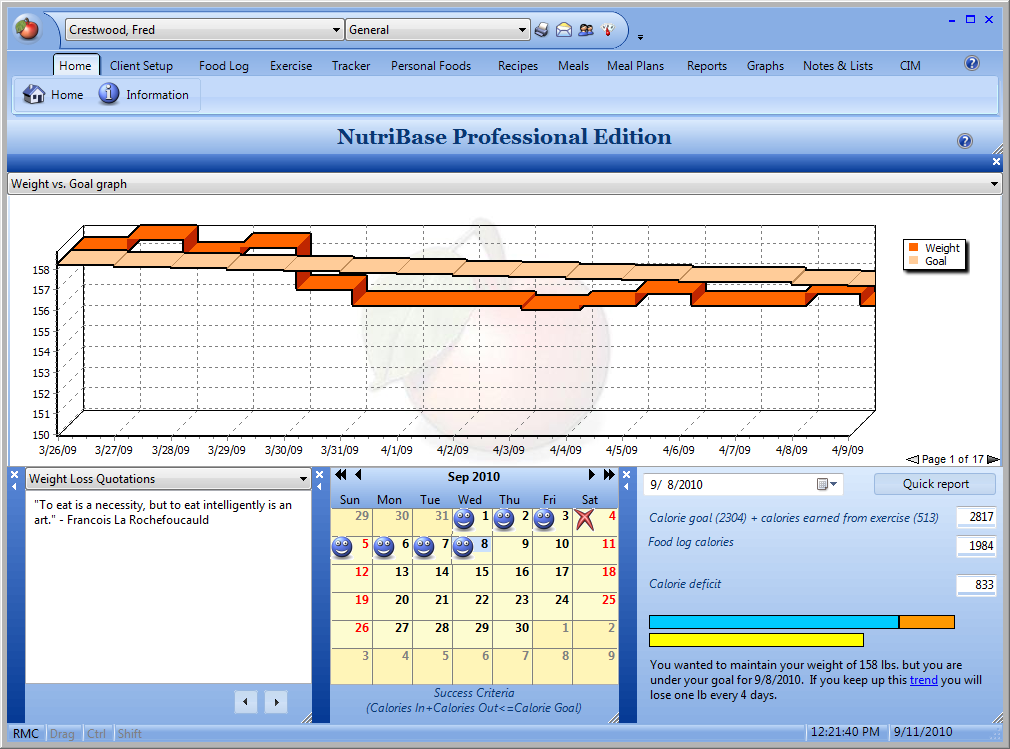
4) The graph shows you the active client's progress over time. The “active client” is the client whose name appears at the top of the windows. To change the active client, click the down arrow next to the client name and select a different client.
5) Click the down arrow just above the graph on the right hand side to select your display options: show body weight, weight v. goal, body fat content, body fat v. goal, both weight and body fat, forecast future weight based on all past performance, etc.
6) Access your choice of weight loss quotes, dieting tips, software usage tips, etc. You can also add your own favorite quotes. Click the down arrow in the NutriBase Tips section (lower left of you Home Window). Select the “My Quotes” option. To edit any existing quotes or to add new quotes, right click and select the option to edit your quotes. Add as many new quotes as you like.
7) The Calendar uses “Happy Faces” to indicate days on which this user did not exceed their Daily Calorie Allotment (which is calculated for you by NutriBase). The “X” icon indicates a day when the user exceeded his Daily Calorie Allotment.
8) Click the “Quick Report” button to generate a quick report that summarizes the most salient information for this client in a compact format.
9) NutriBase allows you to color-code the bar charts in the lower right corner graphs via right click. This user “earned” 513 calories by exercising today... this is indicated in orange on the graph. The blue bar indicates the Daily Calorie Allotment for this user and the yellow bar indicates the actual calories eaten so far today.
10) Right click over the various sections of the home window to see your numerous options. Use right click to set your preferences and customize your home window.
This topic updated 07/24/2015 |